Experimental Report 5:
Measuring the Life Energy Phenomena in a Yeast Culture
by Heliognosis
Background
Until
now the only way to determine if cells are alive or dead is by using
subjective observations such as movement, the presence of metabolism
products, consumption of media, production of gasses etc. The vigor and
health of cells can only be indirectly measured. Wilhelm Reich
illustrated in the Bion Experiments
and later in The
Cancer Biopathy that
cell vigor could be monitored using special techniques such as
dark-field microscopy. Using apochromatic objectives, the blue
energetic glow of healthy cells could be seen directly at high
magnification. Similarly, Reich treated human blood with a salt
solution and observed the length of time before cell death using the
dark-field technique. By careful observation of the cell contraction
and eventual time of cell membrane breakage, he was able to determine
the overall energetic strength of the blood cells and of the person
from whom they were taken. In this report a method for monitoring cell
culture growth and cell vitality is presented using the Heliognosis LM3
Experimental Life Energy Meter in conjunction with a liquid/cell
culture probe.
 |
|
 |
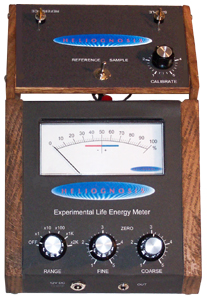
| Fluid Probe
Apparatus and LM3 |
|
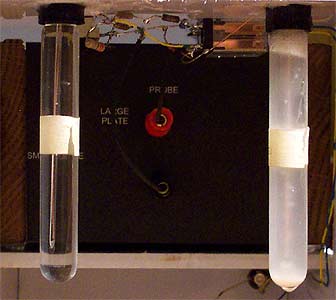
Reference
solution and culture |
Method:
The
Heliognosis Experimental Life Energy Meter Model LM3 Rev B. was placed
on a frame with the reference and sample liquid electrodes mounted
behind. The apparatus was positioned on a wooden table with all other
objects moved at least 18" away. Two test tube solutions were prepared,
each containing exactly 10ml of pure water1.
The two tubes were screwed into the reference and sample electrodes.
The calibration adjustment was carefully rotated until both the
reference and sample electrode read exactly 0% on the x100 range of the
Life Meter. To the sample tube was added 0.8g of Lantic white
granulated sugar. The meter now read 9%. The sample tube was then
unscrewed and 0.2g of Baker's yeast (Fleischmann's) was added. The tube
was immediately screwed into the sample electrode and the timer started.
Observations:
Immediately
upon re-attaching the sample electrode with the yeast solution, the
reading was 12%. The yeast initially sank to the bottom of the tube. A
cloudiness gradually began to form and was distinct after 13 minutes.
After 20 minutes, bubbling began from the bottom of the solution. The
room temperature was 19.5 degrees C.
When
the yeast culture had been growing for 33 minutes, it was observed that
the culture was rising to the top of the solution and a gas filled foam
developed. At this point the readings on the meter, that had been
increasing gradually, began to climb more rapidly. The reference
electrode was periodically checked using the switch on the liquid probe
to make sure that the instrument was still calibrated. If the reference
had deviated away from zero, the Life Meter zero was adjusted to keep
the readings accurate. From 40 minutes onward the surface culture
continued to grow finally to a thickness of 7mm between 94 and 135
minutes. Gasses and culture solution would occasionally overflow from
the vent hole as the growth progressed. Excess was wiped away to
prevent it from altering the reading of the inside culture growth.
After 135 minutes, the evolution of gas and the rate of culture growth
dropped rapidly with the collapse of the surface culture. The deposit
of yeast at the bottom of the tube was now much smaller. Bubbling
continued from below but at a much lower rate.The culture's activity
became insignificant beyond 325 minutes with only occassional bubbles
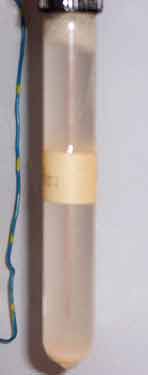
rising from the bottom. Below is shown a picture of the cell culture
after 104 minutes. The Life Meter data is plotted graphically below and
shows the detected energy level of the culture over time
 |
 |
Yeast culture
on solution surface |
Detected energy
level
of yeast culture over time |
Conclusion:
The
visual observations of culture growth and decline matched perfectly
with the data recorded from the Life Meter. During their life cycle,
the cells accumulated energy and then released it again to the
environment. It is now apparent that the displacement currents utilized
by the Life Meter can detect the Life energy present in these cells and
can monitor its increase and decrease over the cells life cycle.This
may lead to the possibility of differential diagnosis of cell health.
Notes
1.Luso
bottled water, containing 41.6 ppm of dissolved salts |